The S&P500 bearish wave joining the August high with the October 2022 low measures 825 points: 4327 to 3502. The 87.50% of the said range is 825 x 0.875 = 722 points. Adding 722 to 3502 (the October low) gives 4224. The high touched last Friday was 4227.At the touch of, coinciding with a bit of (in my opinion useless) blah blah from various FED figures, including Powell and even the resurrected Bernanke, the market retracted, showing its usual hyper-sensitivity, then closing at the magical 4200 value that cashed in an ocean of puts sold at that level expiring at 10 p.m. (Italian time). It then slipped a little more than a point again in the next hour before the market closed for the weekend. Powell said it might be necessary to raise rates less than expected. Leaving in Sibylline interpretation whether it is less than he expected or less than the market expects. Continuing with a hypothetical graphical and numerical interpretation of the performance of the S&P500, we find that the 725-point rise from October 13 to last Friday is composed of three bullish waves, where the first wave performed best.
From Oct. 13 to Dec. 13: 3502 to 4180, points 678
From Dec. 22 to Feb. 2: 3788 – 4208, points 420
March 13 to May 19: 3839 – 4227, points 388
(For the time being, we do not know if the wave is complete, and perhaps it is not).
The values described provide a numerical idea of the flattening of the rise as time passes. Before the August double high, 100 points higher than last Friday’s high, the intermediate technical level is 93.75 percent of the August-October 2022 range: a value that is located at 4276, which is thus the resistance following 4224 and preceding the aforementioned double high of 4327. A hypothetical reaching of the 4276 level, would make the last bullish wave take on the value of 438, just above the previous wave of 420. The total rise from the October low would be 774 points. The 4276 price has additional significance in our market map. Some algorithms project the long-term trend high of the S&P500 at 4571 (possible high to be reached by the end of spring 2024), and 4276 is 37.5 percent of the future range drawn by our algorithm from the December 22 low to the hypothetical long-term high above. If we had entered a truly (albeit moderately) bullish phase, the view would be of a trend to gradually move in the direction described above, which is, precisely, the bullish market map. We know that we have, since the middle of last week, entered the heralded risk area: the new highs of the S&P500 were accompanied by graceful rumors, regarding the possibility of a deal between Democrats and Republicans to raise the federal debt. The press and many analysts (somewhat superficially in our view) are increasingly aligned to predict a last-minute deal, as has occurred many times before (in this sense, the statistics are in their favor). Nonetheless, they have much more to lose for the Democrats than the Republicans from a failure to reach an agreement, and this is the critical variable that had already occurred in 2011, and which the short memory of finance does not seem to take into due consideration.
We continue to urge caution, because we are in the midst of the risk area, accentuated even more by the optimistic visions of a return to normalcy that we see spreading, thanks in part to the good performance of European and world indices. If we are wrong, we will have erred by being overly cautious.
A market descent resulting from a negative event related to federal debt can be very sharp and result in an acceleration of volatility that is quite undesirable for all portfolios. This would not, in our view, be a long-lasting event: the Republicans have the expediency to cause Biden to look bad, but they cannot overdo it. They have to play on the intransigence of the Democrats’ left wing (Biden’s real weakness), and the possibility of breaking the bank is far from unlikely and that is what we fear.
The rating agencies have shown that they are abundantly on the verge of a nervous breakdown: just look at Moody’s, which, after hinting fire and brimstone about Italy’s debt rating, did not show up at the conference scheduled for May 19. “We took a day off,” they could write. Thus, predicting the agencies’ behavior in the circumstance of the U.S. federal debt ceiling is simply impossible, we don’t expect anything good anyway: our feeling is that the rating agencies are becoming less and less credible and increasingly polluted by problems that undermine their actual supposed independence. The Moody’s case has been shamefully egregious, and so full of shame, that no comment has come from them. As explained other times, we are not in a condition exactly comparable with the past, because never has the amount of liquidity injected into the market been so abundant. This makes everything bloody different, and the fact that 2022 was the worst year as far as analysts’ forecasts got it right speaks volumes. But, in the past, we always said, “This time is different.” Then, in the end, it was always too much like the past … so, some disorientation is there, and it’s inevitable.
And when you don’t understand exactly what’s happening, you just watch. I think Gann said that, and in this case we totally agree with him.
There is a macroscopic phenomenon worldwide, which is in fact a huge and unresolved problem of contemporary capitalism: I’m talking about the abnormal distribution of wealth, with an excessively rich tip of the pyramid and a flattening downward of the pyramid. This phenomenon creates two different consequences. The first is psychological, a growing sense of frustration on the part of those who “don’t have” compared to those who “have”; the increasingly widespread conspiracy theses (now about everything and the opposite of everything) are a clear symptom of this frustration. The second consequence is in the financial markets: a few stocks of large companies alone drive the indexes, while the mass of small and medium-sized companies remain underperforming. If you look at the Russell 2000 index compared to the S&P500 you can easily realize how small and medium-sized companies have fallen behind. And, also, how within the S&P500 the smaller firms manifest obvious negative counter-trends compared to the giants (what we call the “tankers” of the market). All of this is an end-of-empire environment. We can perhaps go on a few more years like this: all the great empires in history have fallen on the wrong distribution of wealth.
By 2029 expect a devastating financial crisis, which we most likely place somewhere between 2025 and 2026. Too many knots are coming to a head all at once. It does not mean that the crisis will kill us. The crisis will make us grow, hopefully, to build a more stable financial world. The good reasons to adopt a good management system for your portfolio are growing day by day.
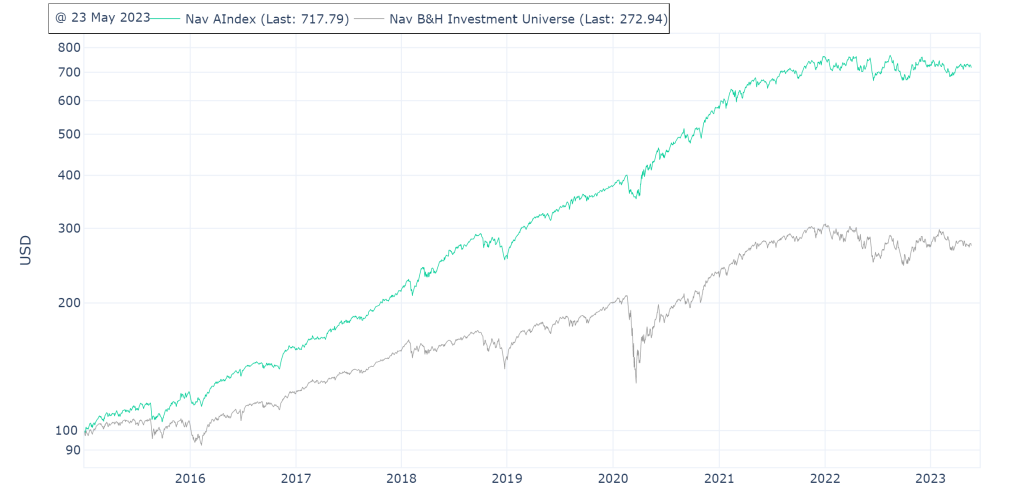
We report the comparative graph of Our AI management on the S&P500 against the same index.