Our deep learning machine based on an artificial intelligence algorithm is developed by Rataran
Machine Learning
Each financial instrument is associated with a binary state that indicates the theoretical convenience of buying that instrument or not buying it (or selling it if it has been bought previously) as of the day after the opening price or NAV value. There is no middle ground (reduce or increase).
The two possible states are “long” and “flat.” Therefore, “short” strategies (which are characterized by unacceptable risks i.e., possible losses greater than the nominal capital employed) are never implemented
Artificial intelligence is used to determine, for each financial instrument analyzed, the probability of going up or down for each of the 20 market days following the day on which the last trading value is taken.
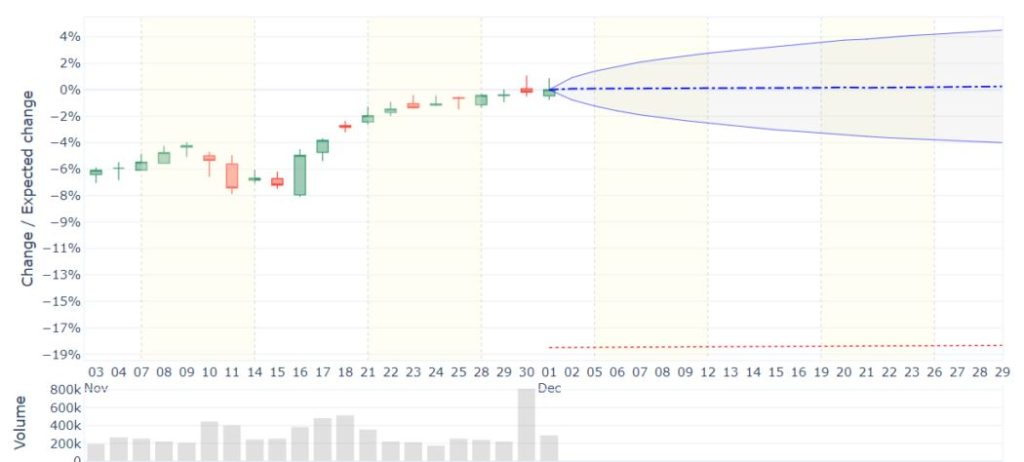
By imposing a limitation on the frequency of trades on the signal calculation model and by setting an average target of one annual buy and one annual sell (turnover = 1), the cumulative outcome of the measured prospective advantage is sufficient to identify advantageous areas within the expected volatility range. The task of the artificial intelligence is to identify among the multiplicity of cyclical trends expressed by each instrument, the one that is most significant in terms of the extent of the range considered.
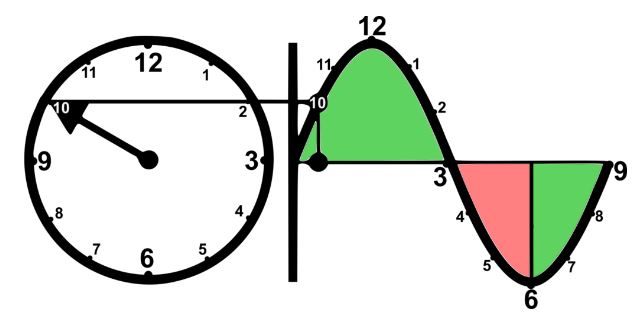
The average probabilistic outcome calculated for more than 50,000 financial instruments, showed the presence of 12 statistically significant areas within each cycle that can be represented on the dial of a hypothetical clock whose hours are synchronized with the cyclical evolution between lows and highs, for the most significant cycle breadth identified by the Machine Learning systems for each instrument analyzed.
The areas can be described as follows:
an area of relative maximum of the cycle (12 o’clock)
an area of relative minimum of the cycle (6 o’clock)
5 areas in the descending phase between the cycle maximum and minimum
5 areas in the ascending phase between the cycle minimum and maximum.
The probabilistic outcomes showed that from 6 o’clock through 12 o’clock to 3 o’clock, the probabilistic outcomes for the next 20 market days are favorable; those between 3 o’clock and 6 o’clock are unfavorable.

The overall most profitable strategy identified by artificial intelligence is basically based on 4 rules:
The system buys at the maximum of the 12 o’clock cycle at each occurrence.
The system buys at the minimum of the 6 o’clock cycle (or close to it) at the first occurrence (In the case of a trade closed at a loss, the system waits for the next trade at 6 o’clock, the completion of a full cycle passing through 12 o’clock).
The system sells at (or near) 3 o’clock on each occurrence.
The system sells when the predetermined stop is reached.
In addition to the preceding rules, the circumstance may arise where trades may also be closed at a profit (typically at 12 o’clock) in the presence of expected annual returns achieved in a very short time frame (less than a week).
Model training is done by weighing more recent events. For the individual instrument, a strongly generalized model is initially adopted that inherits the parameterization from the average of the cluster to which it belongs. Subsequent training will then take place only when there is a change in the signal.
Before the change is confirmed, the network is retrained (obviously with no pre-training signals allowed to be changed).
After retraining only 2 circumstances can occur:
The network confirms the signal
The network denies the new signal. (In this circumstance nothing happens in operational terms other than the refinement of the network itself.)
The stop level is updated daily and can never be lower than the stop level calculated from the first day of application of the current buy signal.
When the profit “target” level is reached, the stop is significantly brought closer to the last value of the instrument.
The system calculates daily for each financial instrument analyzed, at market close, a set of grouping indicators:
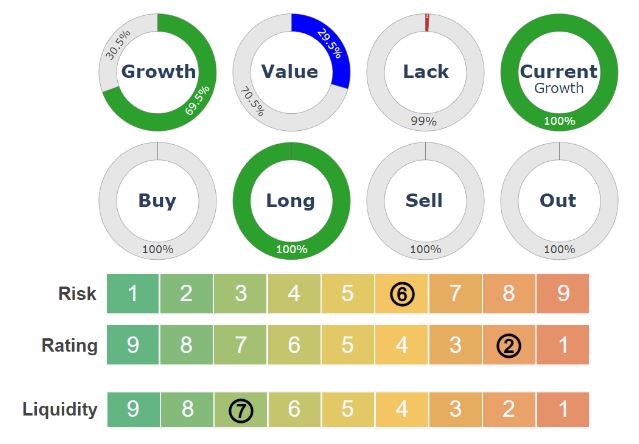
Categorization of 5-year historical and current performance type (Growth, Value, Lack)
Trend (Buy, Long, Sell, Out)
Risk (from 1 = Min, to 9 = Max), calculated using the methodology proposed by ESMA for calculating the “synthetic risk and reward indicator” (SRRI) published in the Key Investor Information Document (KID)
Rating (from 9 = Max, to 1 = Min)
Liquidity (from 9 = Max, to 1 = Min)
Cyclical phase “Clock” (1 to 12)
Entry Price (only in the presence of Long Trend)
Stop price (downward overshooting of the closing price, only in the presence of Long Trend)
Indicators are also calculated for any available statistical or functional aggregation entity of several instruments (and thus also for the indices themselves), which are treated in the same way as any other analyzed instrument.
Each indicator is the result of a formula (i.e., an algorithm) that uses only and exclusively the time series (prices and volumes) of the analyzed instrument.
The effects of this choice are extremely positive as far as the optimal probabilistic outcome is concerned because it is based on technological neutrality (summarized as “same service, same risk, same rules”) that is antagonistic to the human tendency to resort to stereotypes when we are called upon to make decisions, without realizing that we are conditioned by cognitive bias (or cognitive distortion).
In addition to the indicators just listed, an English language commentary is also produced daily for each tool, obtained automatically by means of a text generator.